|
|
June 2019 Newsletter
|
|
School Performance and Equity Profile Year End Data
The Year End 2018-19 School Performance and Equity Profiles are now available! The School Performance and Equity Profile will be updated over the summer to include the same measures as the DMPS School Report Card. 
DMPS School Report Card
The DMPS School Report Card is a comprehensive data profile that provides clarify on the overall health of a school. The DMPS school report card identifies areas for improvement at a school (learning, thriving, or belonging) and which schools are most in need of support. Central office staff will utilize the DMPS School Report Card in the allocation of resources to ensure that schools with the greatest need receive the increased levels of support. The DMPS School Report Card will be released via Tableau during the week of June 10. More details on the calculations in the DMPS School Report Card can be found here. August Attendance Trainings
Please share this registration link with anyone who will be responsible for coding attendance in your building via the Attendance Wizard, sending Attendance Letters, using the classroom monitor, etc. Infinite Campus attendance training for building staff is mandatory on an annual basis. Rights to the Attendance module will ONLY be awarded AFTER attending a 1.5 hour class. Please contact Kellie Hanlon with any questions. |
Uncoded Student Tardy Report
In an effort to assist Office Managers and other building personnel responsible for entering student attendance data, several new tabs have been added to the Attendance Monitoring Reports regarding uncoded tardy data. When the teacher fails to include T1, T2, or T3 in their attendance comments, the script that converts the yellow T does not work. Anything without the teachers comments would then remain as an uncoded yellow T. These need to be changed by building staff to UT or if the information regarding the number of minutes tardy can be obtained, the appropriate T1, T2 or T3 code. 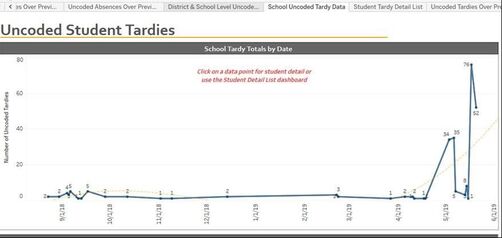
Online Registration Trainings
Please be sure that all of your designees for Online Registration have registered for a mandatory OLR processing class in June or July. |
2018-2019 End of Year Data
|
Summer Dates to Remember
|
2019-2020 School Year Assessment Dates
|
|
July 15: Online student registration opens
August 16: Infinite Campus security reset August 17: Infinite Campus rights request form activated |
We are still working on ISASP dates, but have FAST and MAP dates set. Here they are:
Elementary: FAST: Sept 3 - 17; Jan 6 - 21; May 4 - 21 MAP: Sept 16 - 30, Jan 21 - 31; April 28 - May 16 Secondary: MAP: Sept 3 - 30; Jan 2 - 31 (MS only); April 28 - May 16 |
WAIT... WHAT?
Dear Data Dude:
Our teachers are giving CFAs but are having a difficult time getting the data organized so they can work together to make informed decisions about next steps in their instruction. Any thoughts?
Signed,
Crunched for Time
Dear Crunched for Time,
The people in our department who develop our Tableau reports have come up with a clever way to help your teachers with organizing data. If the teachers giving the same CFA will create an assignment with the exact same name and then create an assignment abbreviation name that starts with PLC, Tableau will pick up this data from Infinite Campus and organize it into a usable view. The view can be found in Tableau by going to Achievement > SRG > Secondary PLC and then selecting the view that meets their needs. A view that I think is very helpful is the Secondary PLC Student Detail. This view can help with student grouping and planning for differentiated instruction. Here’s an example of what could be entered in the assignment to make this work.
Assignment: Quadratic Equation CFA
Abbreviation: PLCQE
Sincerely,
Data Dude
Spotlight on This Month's Data Dude

|
Jeff Panek
Jeff Panek joined the Assessment, Data, and Evaluation team last summer as the Assessment Manager. This role has included all areas of assessments such as MAP, FAST, ACT, and the new Statewide Assessment. He is also assisting schools through the collaborative problem-solving process to help develop school improvement plans and has been involved in the facilitation of the SAMI this spring. When he’s not at work, Jeff can be found chasing after Abigail (13), Eleanor (10), or Kathryn (??) as they participate in running, soccer, triathlons, and any number of other activities. You may also find him at a nearby driving range or golf course preparing to play in an upcoming golf tournament. |

|
PAST NEWSLETTERS
